
By Varun Patel, Founder & CEO of Crawlify | Nov 18, 2026 | 12 min read
Price Transparency Files Are Public. Why Is Hospital and Payer Rate Data Still Unusable?
Every U.S. hospital and non-grandfathered health plan must publish its prices, yet the files are huge, inconsistent and full of values that do not mean what they seem. Here is what breaks in hospital and payer rate data, why, and what a usable feed requires.
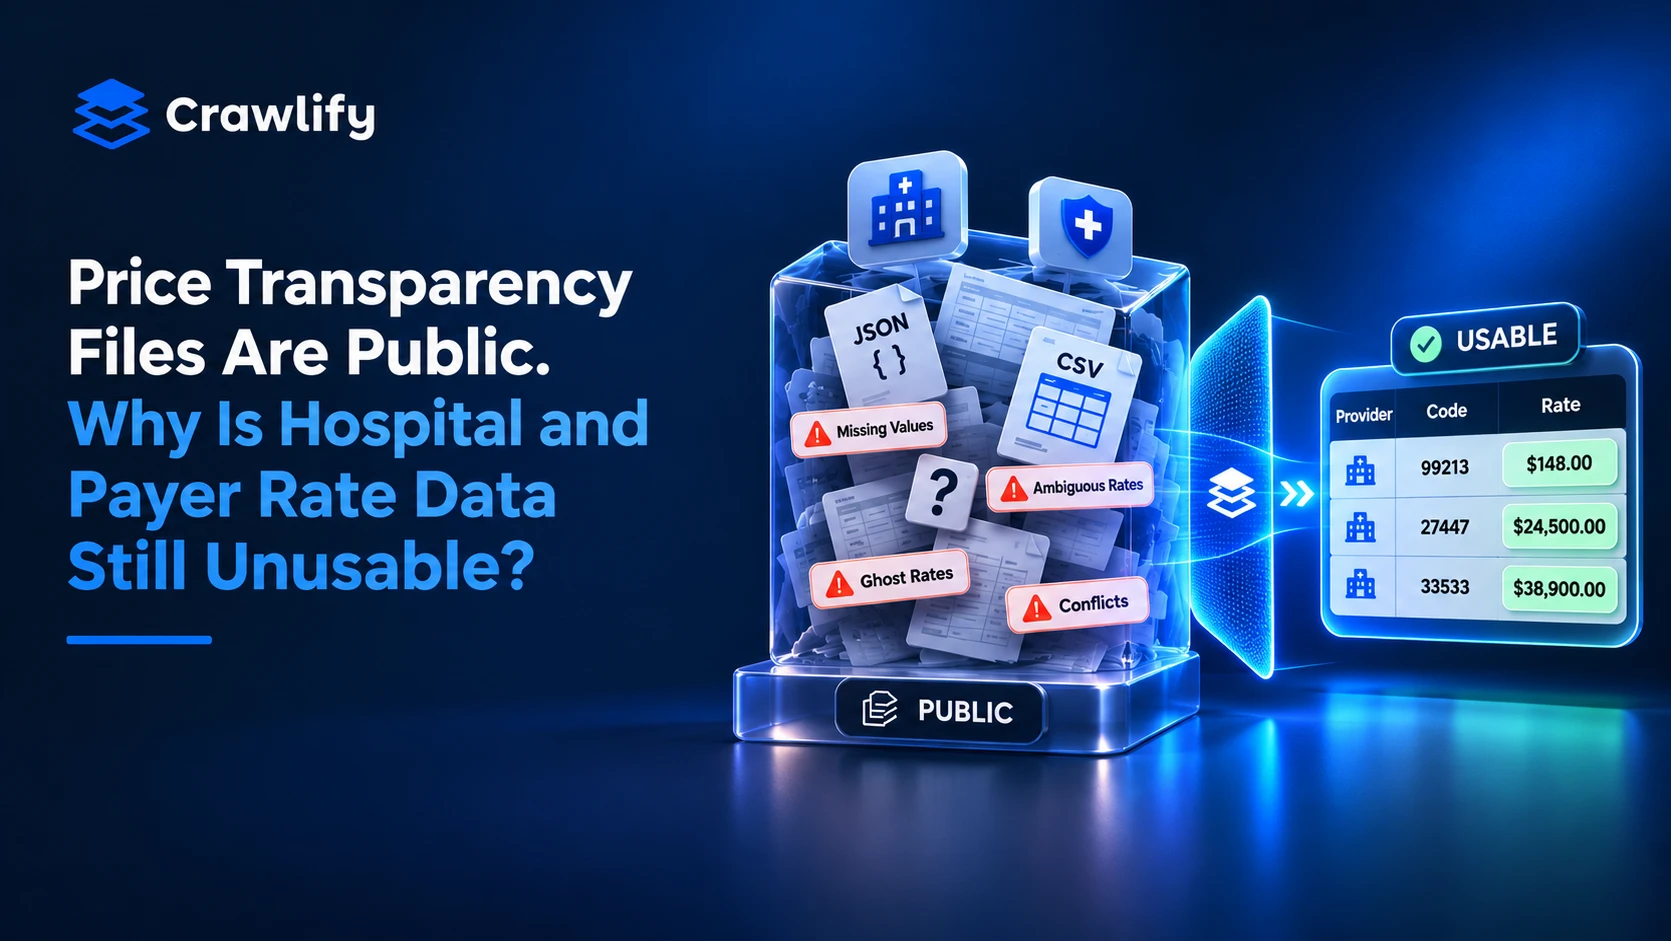
Every licensed hospital in the United States has to post its prices, and every non-grandfathered health plan has to publish its negotiated rates. The files exist. The trouble starts when a pricing analyst, a benefits platform or a billing team tries to load one. One advocacy group’s September 2026 review found that 49.4% of 2,000 hospitals were fully compliant with the federal rule. That is the highest figure it has recorded, and it still leaves roughly half short. Even a compliant file is not necessarily a usable one.
TL;DR — Hospitals and insurers are legally required to publish negotiated rates, but the raw files are still hard to use. Payer files can run to a terabyte each. Hospital files encode the same kind of rate in different ways. Fields that CMS added in 2026 to add clarity are often empty. New rules will help, but the main payer changes do not apply until 2027 and 2028. Analytics firms, benefits platforms and medical-billing teams cannot wait for that. They need rate data that is discovered, parsed, normalized and validated before it reaches a model or a dashboard. This post explains what breaks, why, and what a usable feed requires.
Why “public” does not mean “usable”
Price transparency was meant to turn hospital pricing into something a buyer can compare. Federal rules now require hospitals to publish gross charges, discounted cash prices and payer-specific negotiated charges, and to make the data available in a machine-readable file. Health plans have a parallel duty. The data is real, it is free, and it is updated on a schedule.
The gap is between published and decision-ready. A rate that cannot be matched to a provider, a billing code and a contract is a number, not an input. One benefits-industry analysis notes that few employers have internal analytics teams that can parse massive price transparency files and produce market benchmarks. That is the gap this post is about.
There are three layers to it. The files are large. They are inconsistent from one publisher to the next. And some of the values do not mean what they appear to mean, because they are percentages, formulas or leftovers from expired contracts.
Two rules, two very different files
The word “transparency” covers two separate federal rules, and they produce different data. Hospital files come from the Hospital Price Transparency rule. Payer files come from Transparency in Coverage (TiC). Buyers usually need both, because the hospital file shows what a hospital says it has negotiated, and the payer file shows what the insurer says it has agreed to pay.
| Hospital Price Transparency | Transparency in Coverage (payers) | |
|---|---|---|
| Publisher | Every licensed U.S. hospital | Non-grandfathered group health plans and issuers |
| Files | One comprehensive file of standard charges per hospital | Separate files for in-network rates, out-of-network allowed amounts and prescription drugs |
| Core content | Gross charges, discounted cash price, payer-specific negotiated charges, min and max negotiated charges | Negotiated rates by provider, billing code and plan |
| Typical size | Many large hospitals publish files under 200 MB; some advocates have flagged multi-gigabyte files | One national carrier warns that single files can reach 1 TB; another lists about 400 in-network files totaling 2.5 TB |
| Update cadence | At least annually | Monthly today; quarterly for in-network and allowed-amount files from April 1, 2027 |
What the 2026 hospital rule fixed, and what it did not
The CY 2026 outpatient payment final rule changed what hospitals must encode. Starting January 1, 2026, with enforcement from April 1, 2026, hospitals must report the median, 10th percentile and 90th percentile allowed amounts, plus the count of allowed amounts behind them, when a negotiated charge is based on a percentage or an algorithm. The figures are calculated from actual remittance data, meaning EDI 835 files. Hospitals must also encode organizational NPIs and have a senior official attest that the data is accurate and complete.
That is a real improvement. A hospital can no longer simply post an estimate where it has actual payment data. But early independent analysis shows the files are still difficult to read. A KFF review of rates for two common admission codes, using Turquoise Health data, found five recurring problems:
Base and final rates are ambiguous. Both use the same data element, so a user often has to read free-text notes to know which one was reported.
The new fields are often empty. Median, percentile and payment-count fields frequently come back blank, and some dollar rates appear never to have been paid.
Algorithm and notes fields are used inconsistently. Hospitals handle them differently despite CMS guidance.
Stop-loss and outlier arrangements are encoded in different ways.
One hospital-payer pair can show several rates. Per-diem and other combinations can look like multiple prices for a single service.
Compliance data tells the same story. The advocacy group behind the 49.4% figure says hospitals continue to post algorithms and percentages in place of dollar-and-cents prices. The hospital industry disputes such tallies, and CMS is the official arbiter of compliance. Another tracker found that more than 90% of hospitals had at least posted a file, which is a different measure from whether the file is complete.
Why payer files are a scale problem
Payer files are where the size problem is most acute. They list every negotiated rate by provider, code and plan, so the same rate repeats many times. One analysis of Aetna and UnitedHealthcare files from early 2025 put the combined raw data at more than 20 terabytes. A single regional carrier publishes about 400 in-network files averaging 7 GB each.
Size is not the only issue. Providers are identified through reference tables, billing codes need clinical context, and a rate attached to the wrong code or the wrong network can mislead. Turquoise Health tracked 219 payer files and parsed 206 of them, about 94%. Its scoring found conflicting rates, where one service carries several distinct rates with no clear way to tell them apart, to be the most widespread quality issue.
Regulators have acknowledged this. The Transparency in Coverage final rule, published October 6, 2026, takes effect December 7, 2026 and is phased in through July 2028. It moves reporting from plan level to provider-network level, adds an executive attestation, and introduces new context files. It did not adopt the proposed change-log file or enrollment counts.
| Requirement | What changes | Applies from |
|---|---|---|
| Network-level in-network files | One file per provider network, with network name, ID and product type; unlikely provider-rate combinations excluded | March 6, 2027 |
| Quarterly cadence | In-network and allowed-amount files move from monthly to quarterly; drug file stays monthly | April 1, 2027 |
| Executive attestation | Senior official attests that rate data is true, accurate and complete | March 6, 2027 (new files: September 6, 2027) |
| Taxonomy files (new) | Include exclusion logic | September 6, 2027 |
| Utilization files (new) | List the providers who were paid | July 1, 2028 |
Until those dates arrive, current files remain in force, and the first network-level files are still months away. Teams that need rate data today have to work with the existing, larger and messier format. Even afterward, new schemas (version 3.0 for rate files) mean parsers will need updating.
Six data defects that quietly break analytics
The most expensive problems are not the ones that stop a pipeline. They are the ones that let a wrong number through. These are the defects we would screen for first, drawn from published analyses of hospital and payer files.
| Defect | What it looks like | Downstream impact |
|---|---|---|
| Ghost rates | Rates posted for services a provider does not perform, or for thousands of codes no practice uses | Inflated provider counts and distorted market medians |
| Conflicting rates | One service with multiple distinct rates and no field that distinguishes them | Benchmarks that swing depending on which rate is picked |
| Percent-of-charges and algorithms | A rate expressed as a share of billed charges or a formula, not a dollar figure | Cannot be compared with dollar rates without extra data |
| Base vs. final ambiguity | Base rate and adjusted rate share one field; the difference is in free text | Understated or overstated contract values |
| Empty new fields | Median, percentile and payment-count fields blank or paired with zero payments | Unclear whether a rate is ever actually paid |
| Outliers and expired records | Surgical codes far from Medicare benchmarks; rates for retired codes or lapsed contracts | False savings or underpayment flags |
One scoring exercise found that about 90% of the outlier rates it flagged were surgical HCPCS codes outside reasonable bounds when compared with Medicare outpatient rates. Outliers are not always errors, but they need a flag, not silent inclusion.
What each buyer actually needs from the data
The same raw file serves three different jobs, and each buyer defines “usable” differently.
| Buyer | What they do with the data | What usable means to them |
|---|---|---|
| Analytics firms | Build rate benchmarks, market-level price indexes and models, often combining negotiated rates with claims | Stable identifiers for hospital, payer, plan and code; consistent rate types; history over time; quality flags |
| Benefits platforms and advisors | Compare networks and carriers, support RFPs, estimate expected spend for employer groups | Rates matched to geography and network, ghost rates removed, rates that can be paired with utilization data |
| Medical-billing and RCM teams | Rebuild client fee schedules, check contracts, look for underpaid claims | Code-level rates by payer and provider, with modifiers handled and a clear base-versus-final distinction |
One caution applies to all three. Published rates are negotiated amounts, not paid claims, and transparency data does not carry the utilization needed to aggregate providers into market-level results by itself. Serious users pair it with claims or census data. A clean rate file is a strong input, not a finished answer.
What a usable rate feed takes
Closing the gap is an engineering and data-quality job, not a one-off download. A managed pipeline for this data generally needs five stages:
Discover. Find each hospital’s current file and each payer’s table-of-contents file, and detect when they move or change. Links are often buried in website footers, and files get replaced without notice.
Extract. Stream very large JSON and CSV files rather than loading them whole, and handle schema versions side by side, as the 2026 rule changes introduce new ones.
Normalize. Map hospitals, providers and payers to stable identifiers such as NPIs, standardize billing codes and modifiers, and separate dollar rates from percentages and formulas.
Validate. Apply rules for ghost rates, conflicting rates, outliers against Medicare benchmarks and expired records, and attach a quality flag to each row instead of deleting suspect data.
Deliver. Send the result in the format the buyer already uses, such as a warehouse table, an API or a scheduled export, with change tracking so customers can see what moved between refreshes.
What this does and does not solve. It cannot fix a file that was never published or that is incomplete at source. It can flag gaps so you know what you do not have. It does not turn negotiated rates into what a patient will pay. Deductibles, coinsurance and billing practices still sit between the two. It does not replace legal review. The files are published under federal mandates, but terms of access and your intended use are worth confirming with counsel.
Crawlify builds this kind of pipeline for U.S. data buyers: discovery, extraction, normalization and validation, delivered as structured data with quality scores. If you can name the hospitals, payers or billing codes you care about, we can scope a pilot around them.
See your own hospitals, payers and billing codes covered. Name the rate data you need and we will scope a pilot around it. Talk to Crawlify →
This post is general information, not legal advice. Figures and rule dates come from the sources and rules in force as of November 2026 and can change, so check the current rule text before relying on them.
Frequently Asked Questions
