







Financial & Alternative Data

Alternative data your compliance team can approve and your models can trust.

Human-verified, point-in-time web data for investment teams. Hiring velocity, salary trends, and workforce signals: ticker-mapped, compliance-documented, built for backtesting.

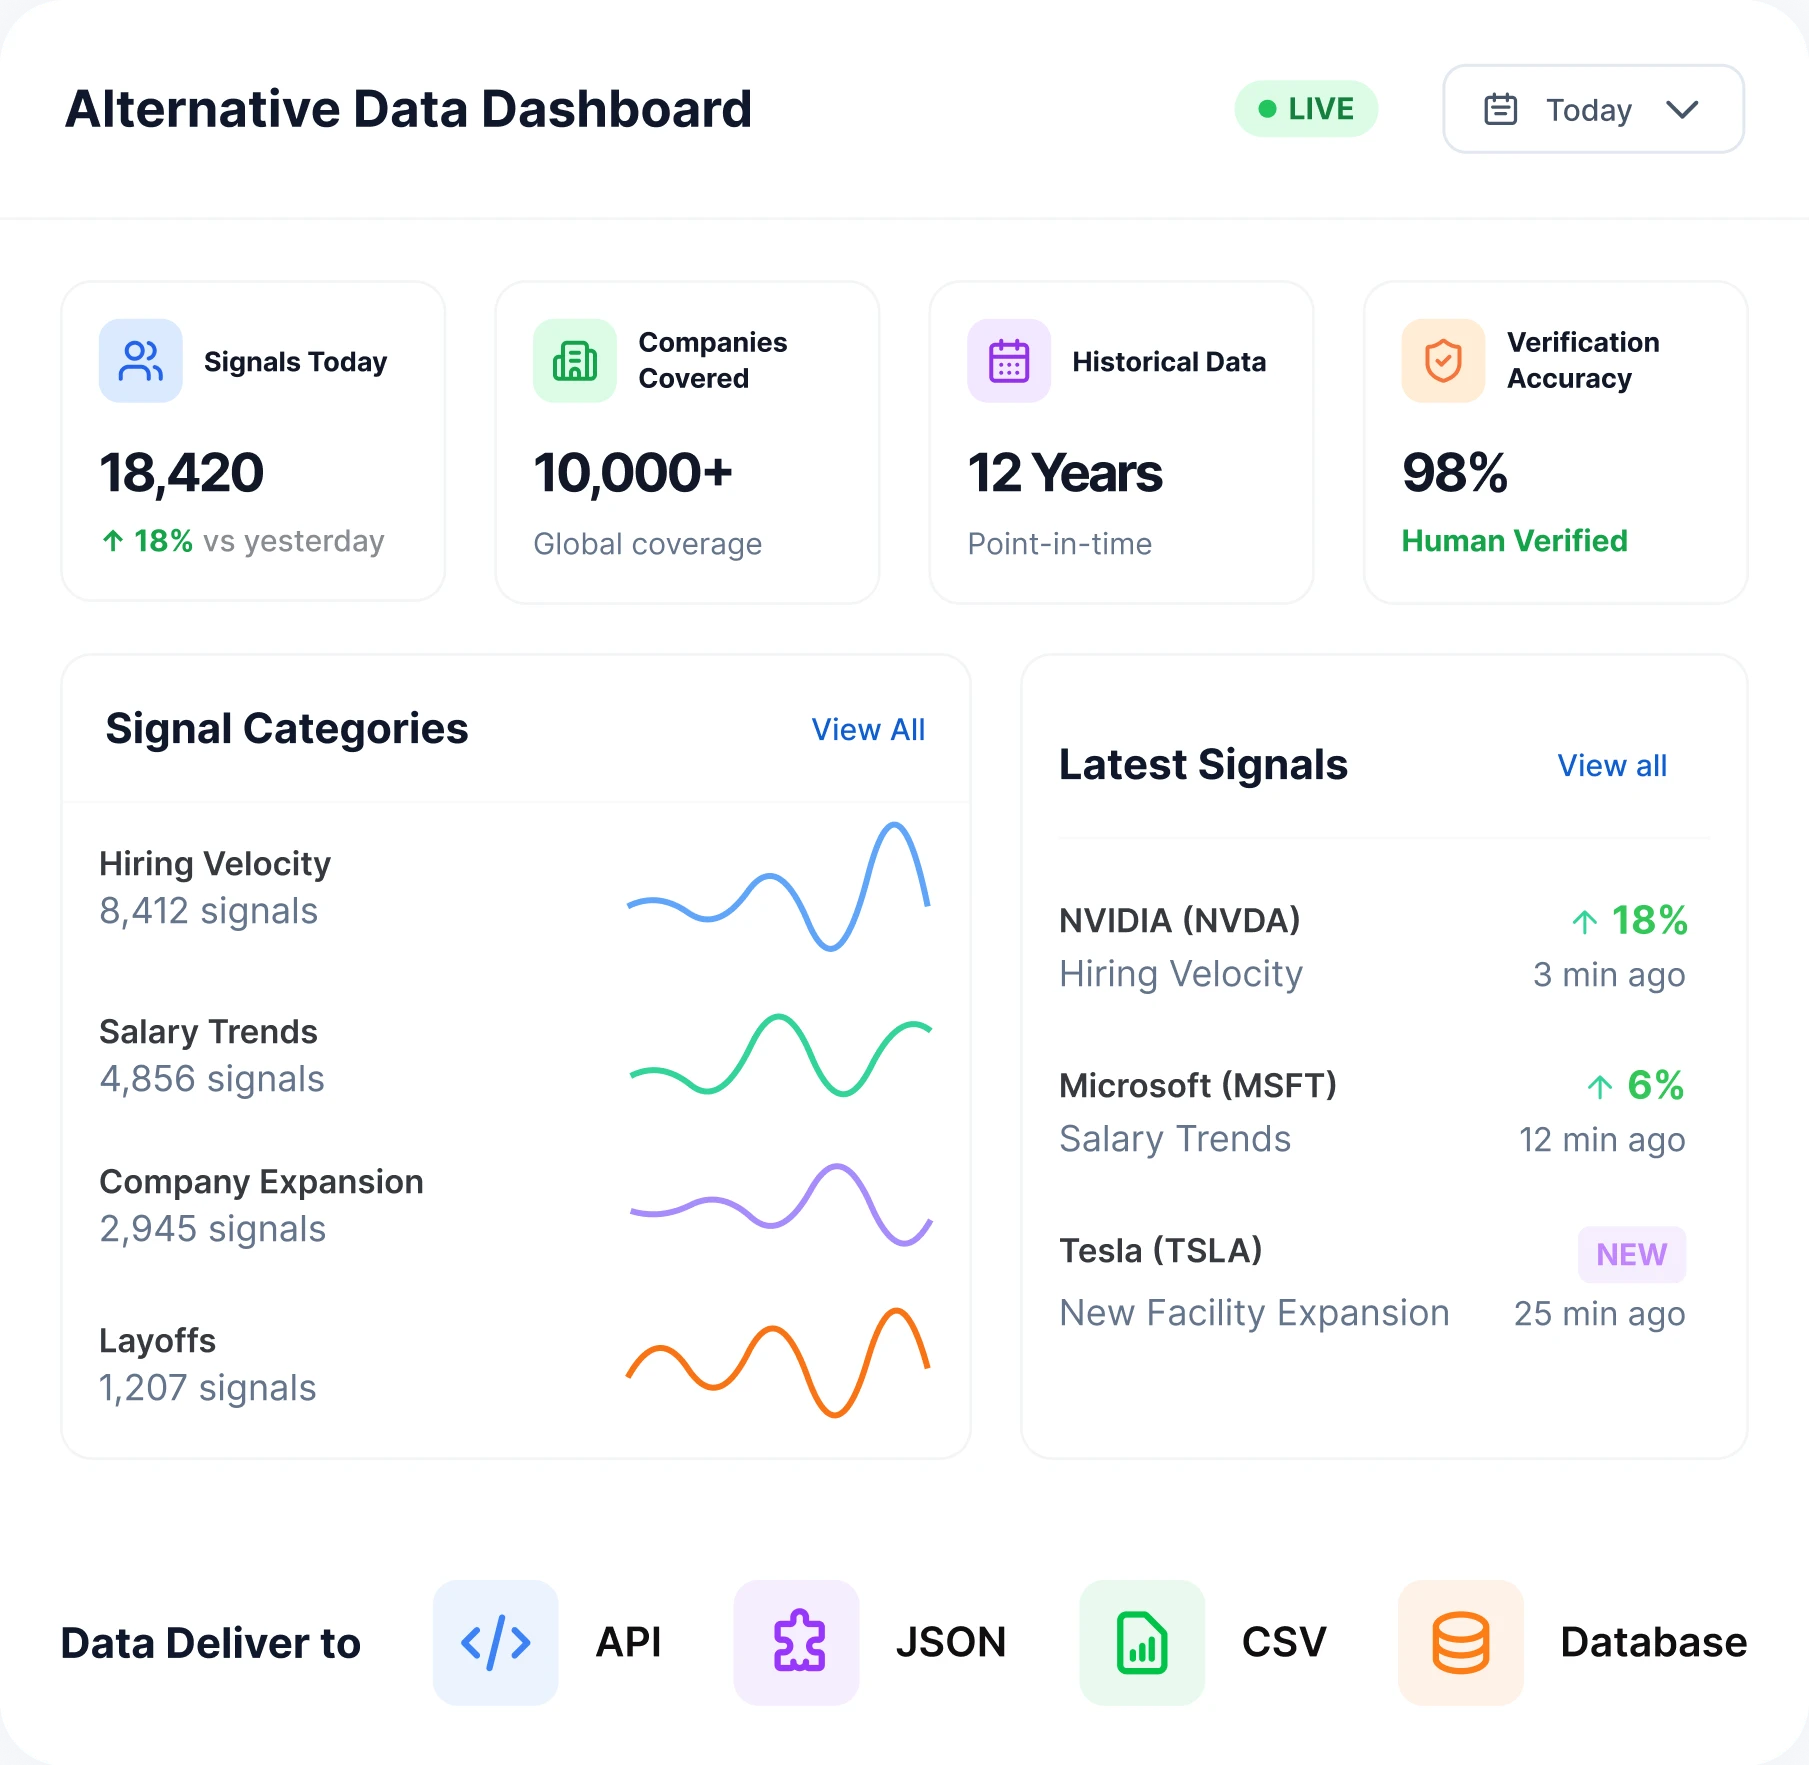
An alternative-data dashboard: signals today, companies covered, historical depth and verification accuracy, with signal categories and a live feed of the latest ticker-mapped signals
  • ScholarMeet
  • Scholar9
  • AllEvents
  • HirePilot
  • SummitStudio
  • EventAtlas

The Problem

Bad data doesn't just miss alpha. It creates false signals.

A quant seeing a phantom hiring surge as ghost job listings inflate a hiring-velocity signal

Ghost jobs corrupt hiring-velocity signals.

18 to 27% of online job listings are ghost jobs. Aggregated data sources count them as real demand. Your model reads phantom hiring surges. The expansion signal that looked compelling in backtest evaporates in live trading.

An analyst discovering look-ahead bias after a vendor quietly corrected historical records post-delivery

Retro-adjusted history invalidates backtests.

Some vendors quietly correct historical records after delivery. Your backtest uses data that wasn't available at the time. Your compliance team calls it look-ahead bias. The strategy that worked on paper never existed in reality.

The Data Product

Built for backtesting. Documented for compliance.

The full technical specification, rendered like a data dictionary your data team can evaluate.

98% accuracyHuman Verified
Talk to Our Alt-Data Team

  • 10,000+ US employers tracked across ATS career sites and 30+ niche boards
  • Public company ticker mapping for 3,000+ tickers

Sample Data

One verified record, end to end.

This is what arrives in your stack: structured, source-traceable, and human-verified.

Talk to Our Alt-Data Team
signal_record.json
{
  "ticker": "CRM",
  "company": "Salesforce",
  "signal_type": "hiring_velocity",
  "period": "2026-Q1",
  "value": "847 net new postings",
  "change_qoq": "+12.4%",
  "department": "R&D / Engineering",
  "geography": "United States",
  "source_count": "31 boards plus ATS career site",
  "point_in_time_date": "2026-03-31",
  "methodology": "ghost-job filtered, deduplicated, human-verified",
  "verified_at": "2026-06-21"
}

Sources & Coverage

What we deliver. What it tells you.

Hiring Velocity

New postings per week by employer, department, geography. Net posting change (opens minus closes). Updated daily, ticker-mapped.

  • Signals: expansion, contraction, strategic pivots
  • Update frequency: daily
  • Ticker-mapped
  • Use case: a sustained posting surge in R&D signals product investment; a freeze in customer-facing roles signals contraction


Salary Trends

Posted compensation by role, geography, and employer. Tracks wage inflation/deflation at the company level.

  • Covers 18+ salary-transparency states
  • Normalized to annual figures
  • Update frequency: daily
  • Use case: track wage inflation or deflation and salary competitiveness at the company level

Skills Demand Shifts

Extracted skills from job descriptions, mapped to taxonomy. Tracks which technologies, certifications, and capabilities employers are investing in.

  • Signals: product roadmap direction, capability buildout
  • Update frequency: weekly
  • Use case: see which technology and capability investments employers are making

Workforce Composition

Department-level hiring patterns (engineering vs sales vs operations). Ratio shifts signal strategic changes months before they hit investor presentations.

  • Department-level patterns: engineering vs sales vs operations
  • Update frequency: weekly
  • Use case: ratio shifts signal strategy changes before investor presentations

Who Buys This Data

How investment teams use this data.

An equity long/short desk tracking hiring velocity at target companies as a ticker-level signal

Equity long/short

Track hiring velocity at target companies. A sustained posting surge in R&D signals product investment. A freeze in customer-facing roles signals contraction. Weekly signal, ticker-level.

A macro strategist reading aggregate hiring trends by sector and geography ahead of official data

Macro / thematic

Aggregate hiring trends by industry and geography. Identify sector rotation, regional growth shifts, and skills-demand waves before they appear in BLS data. Monthly signal, sector-level.

A private-equity team assessing a target's workforce health during due diligence

Private equity due diligence

Assess target company workforce health: headcount trajectory, department composition, attrition signals, salary competitiveness vs peers. Pre-deal and post-acquisition.

A corporate strategy team monitoring competitor hiring in real time to spot talent clusters forming

Corporate strategy / competitive intelligence

Monitor competitor hiring in real time. Which companies are staffing up in AI? Who's cutting sales teams? Where are talent clusters forming?

How It Works

Four stages. Zero bad data.

  • Two colleagues scoping data sources and delivery format against a whiteboard plan

    Scope

    Tell us what you need, from which sources, in what format. We handle feasibility and scheduling.

    Learn more
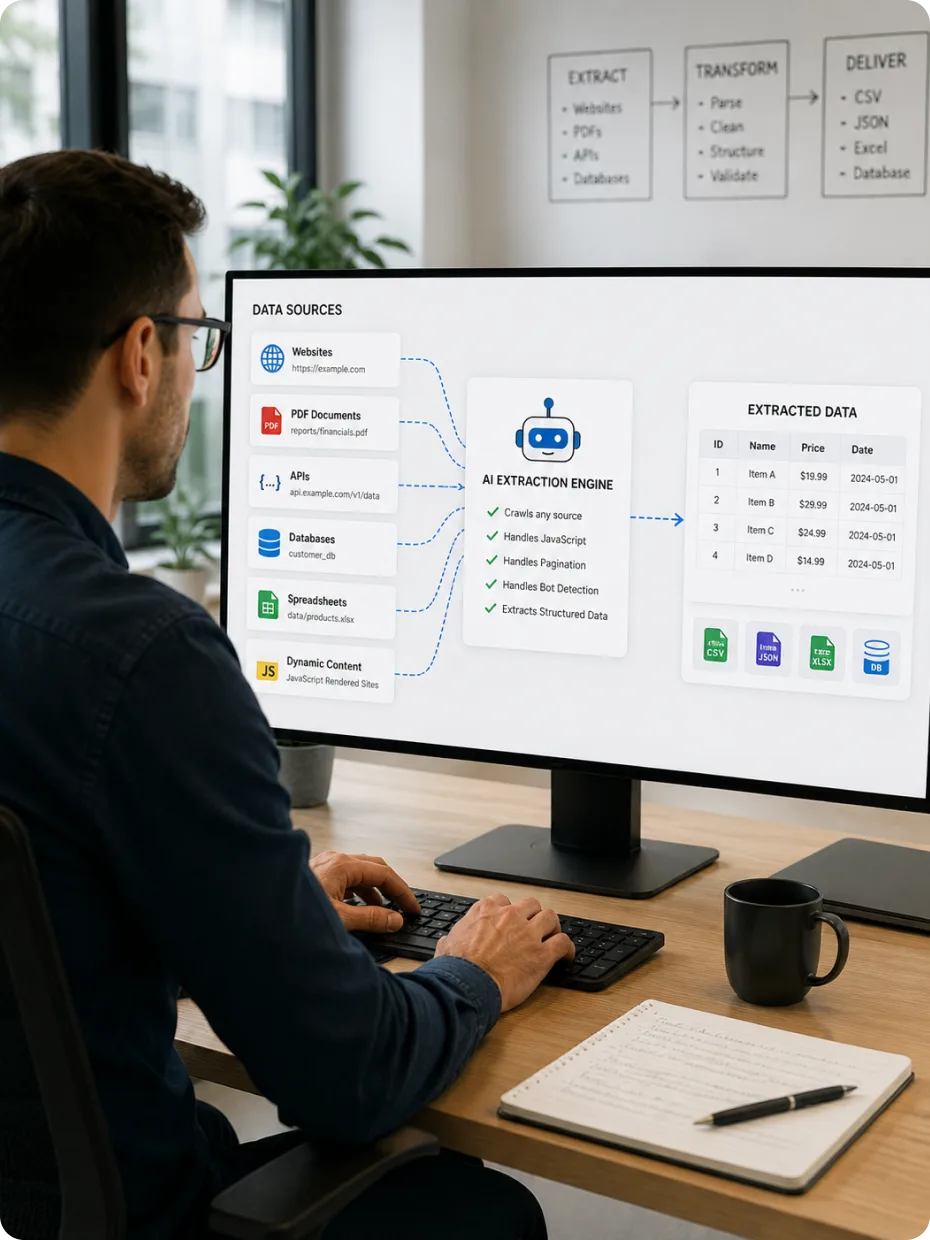
  • An extraction engine pulling structured records from websites, PDFs and APIs

    Extract

    Our AI engine crawls any source. JavaScript-rendered sites, PDFs, APIs, dynamic content. Handles pagination and bot detection.

    Learn more
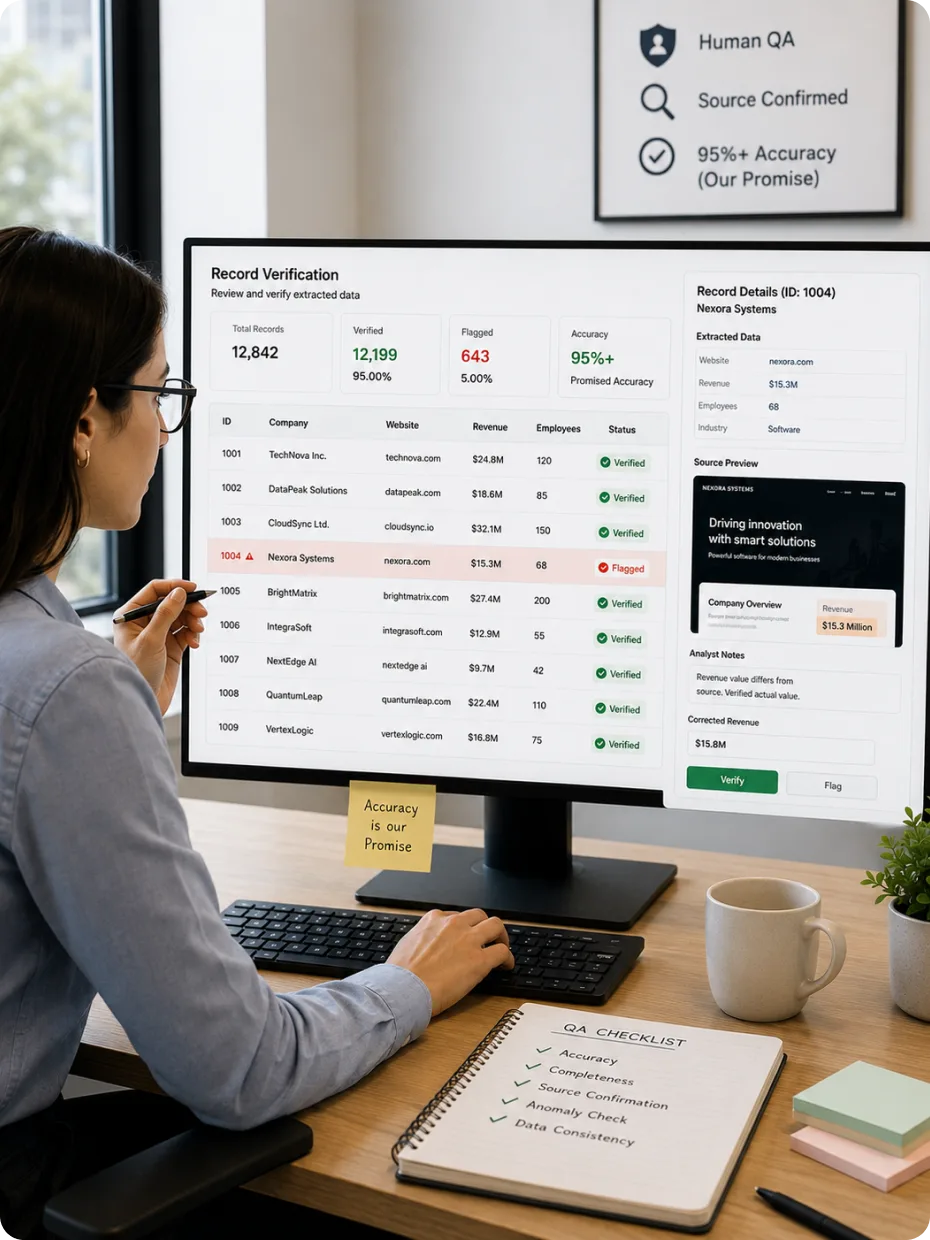
  • An analyst running human QA over extracted records, flagging anomalies and confirming sources

    Verify

    Every record goes through human QA. Our analysts check accuracy, flag anomalies, confirm source. 98%+ verified accuracy.

    Learn more
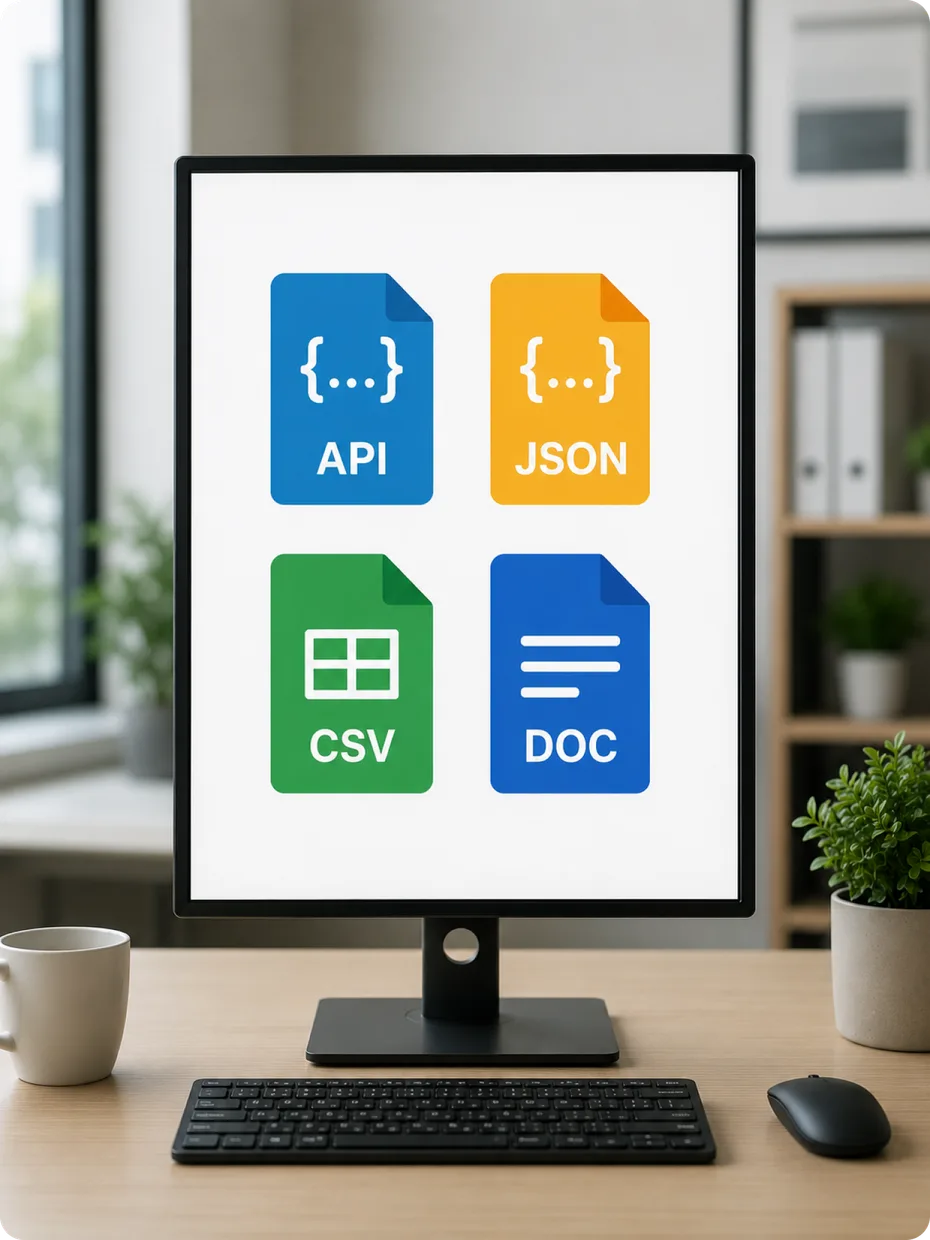
  • Verified data delivered into a customer's stack via API, warehouse and spreadsheet destinations

    Deliver

    Clean data flows to your stack. REST API, S3, Snowflake, webhooks, Google Sheets, CSV. On your schedule. Logged and retried.

    Learn more

Stage 1 of 4: Scope

How It Compares

Where Crawlify fits in the alt-data stack.

CapabilityRevelio LabsLinkUpThinknumCrawlify
Human-verifiedNoNoNoyes, every batch
Accuracy guaranteenot publishednot publishednot published98% verified
Point-in-time integrityyes, monthly from 2008yes, daily from 2007Yesyes, from inception
Ticker-mappedextensive10,000+extensive3,000+
Niche board coverageLimitednoneLimited30+ boards
Compliance documentationpartialpartialpartialyes, full audit trail
Custom signalslimitedNoLimitedYes
Mid-market pricing$85K/yrenterprise custom$16.8K/user/yr$50K to $250K/yr

Use Cases

Start with a pilot. Backtest before you commit.

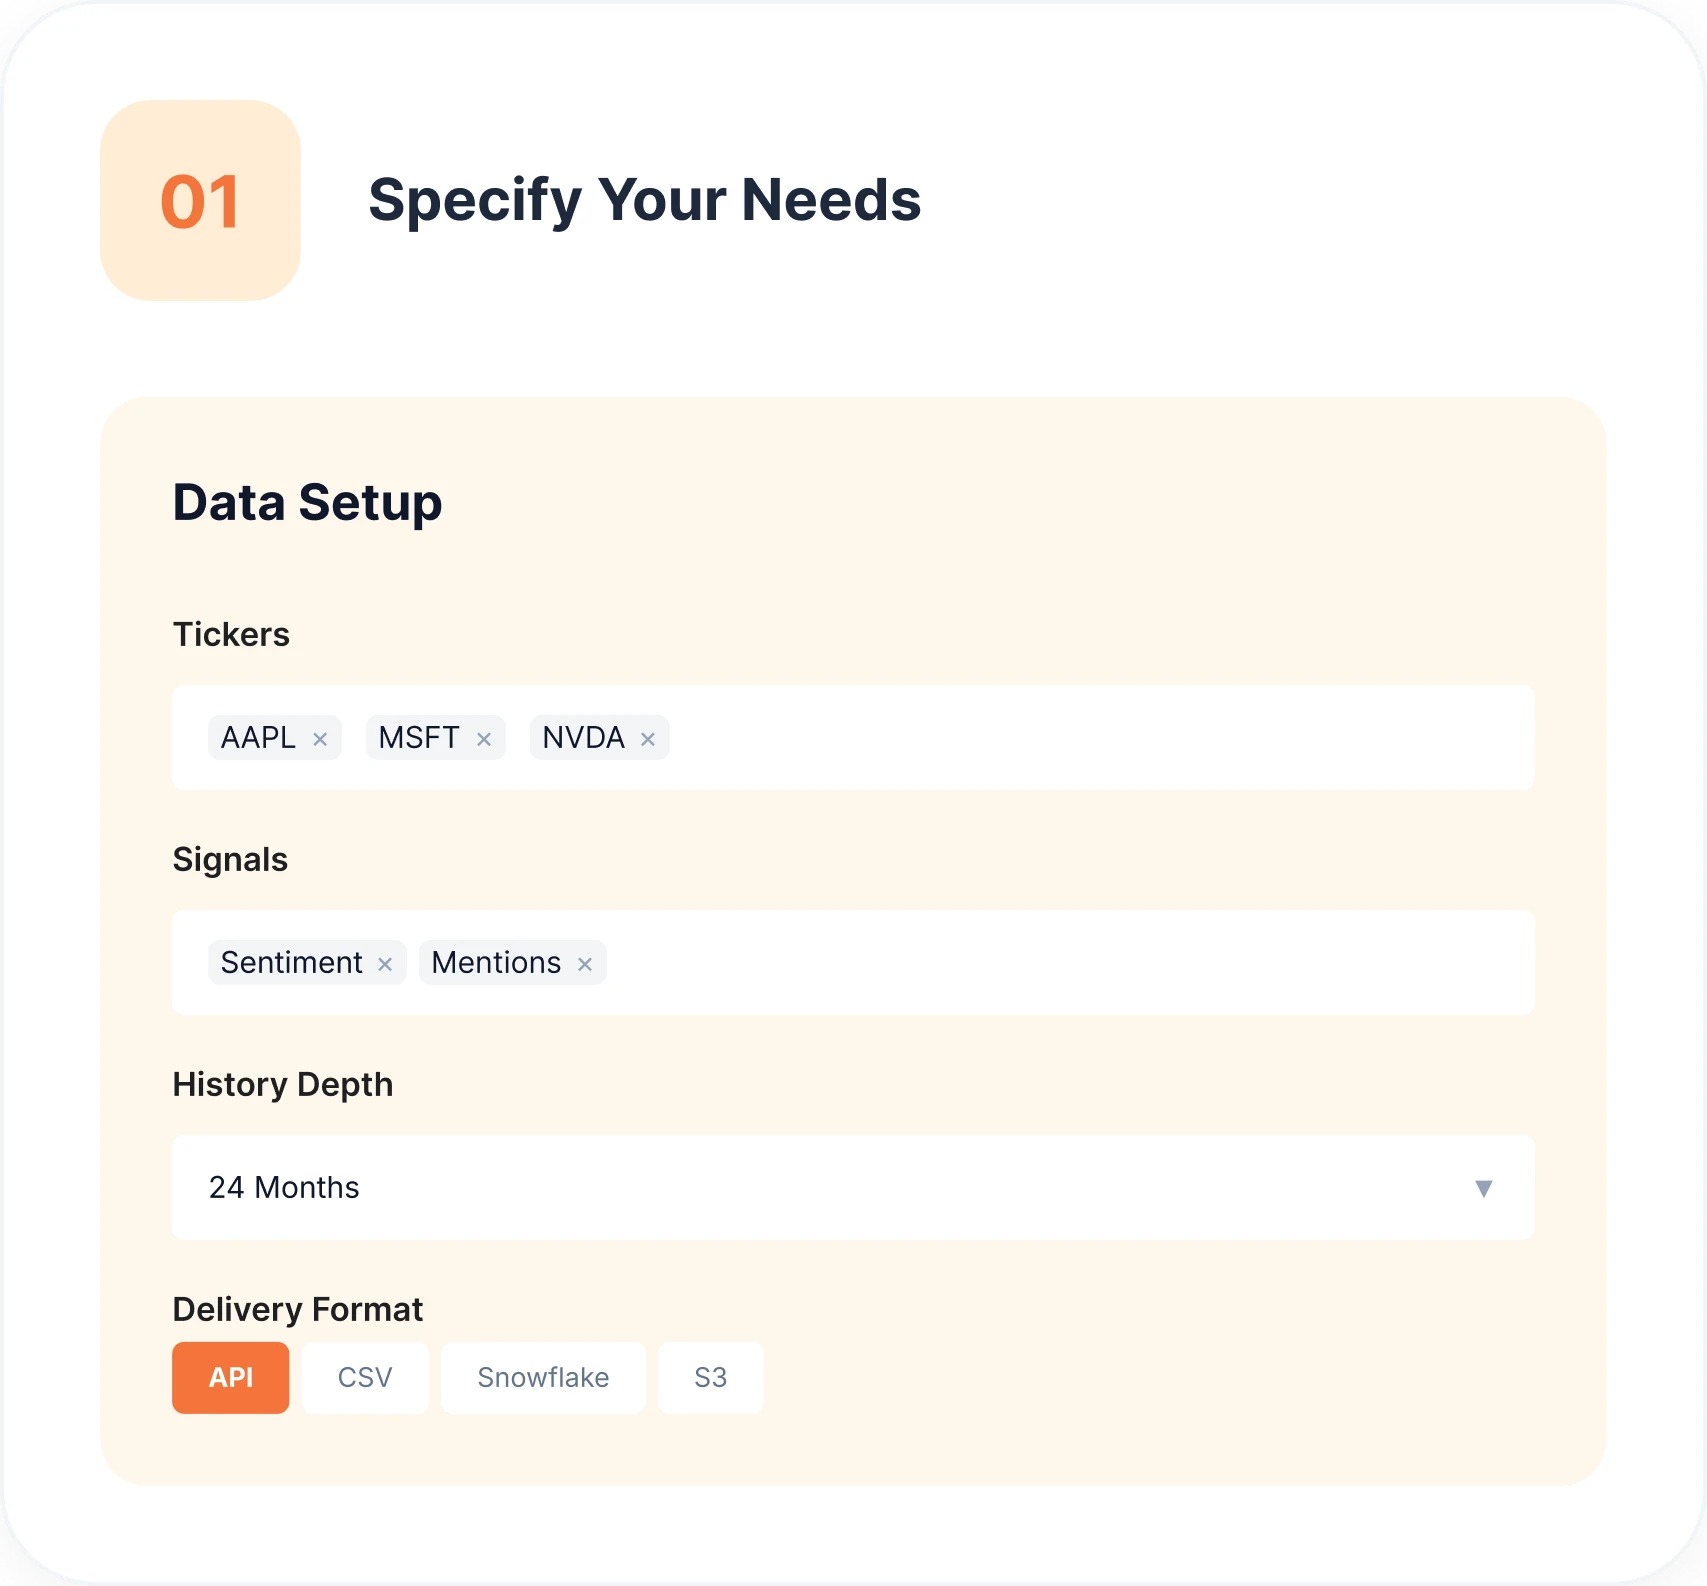
A pilot intake step where an investment team specifies the tickers, signals and history depth they need

Step 1: You specify

You tell us which tickers, which signals, and what history depth you need.

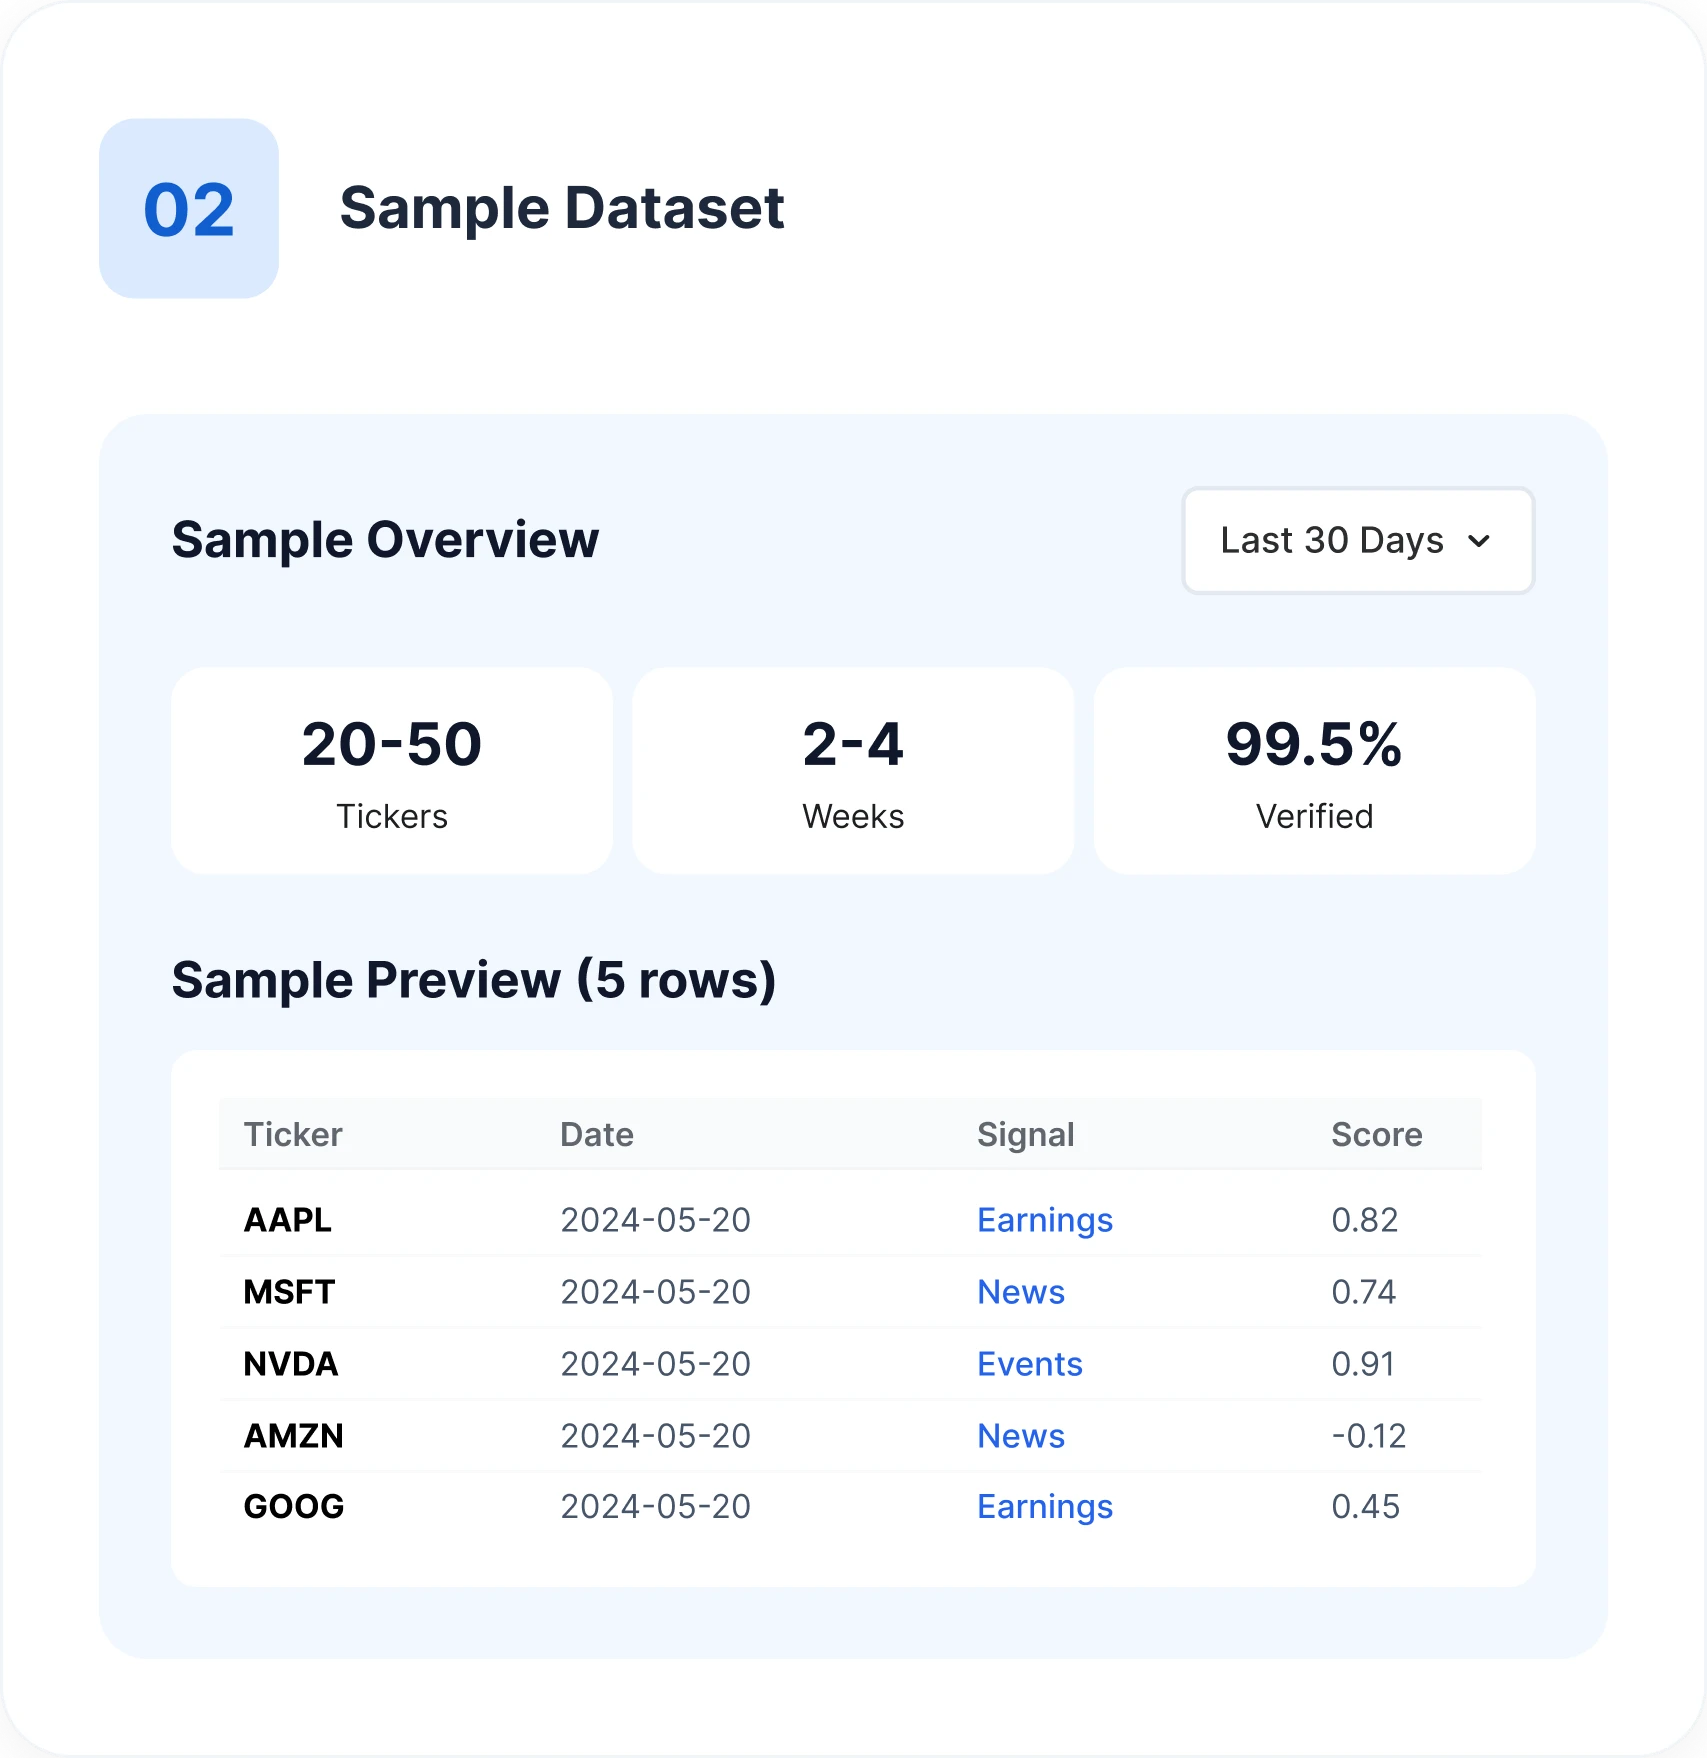
A scoping step delivering a sample dataset of a few weeks of data across a set of tickers

Step 2: We scope and sample

We scope coverage and deliver a sample dataset of 2 to 4 weeks of data covering 20 to 50 tickers.

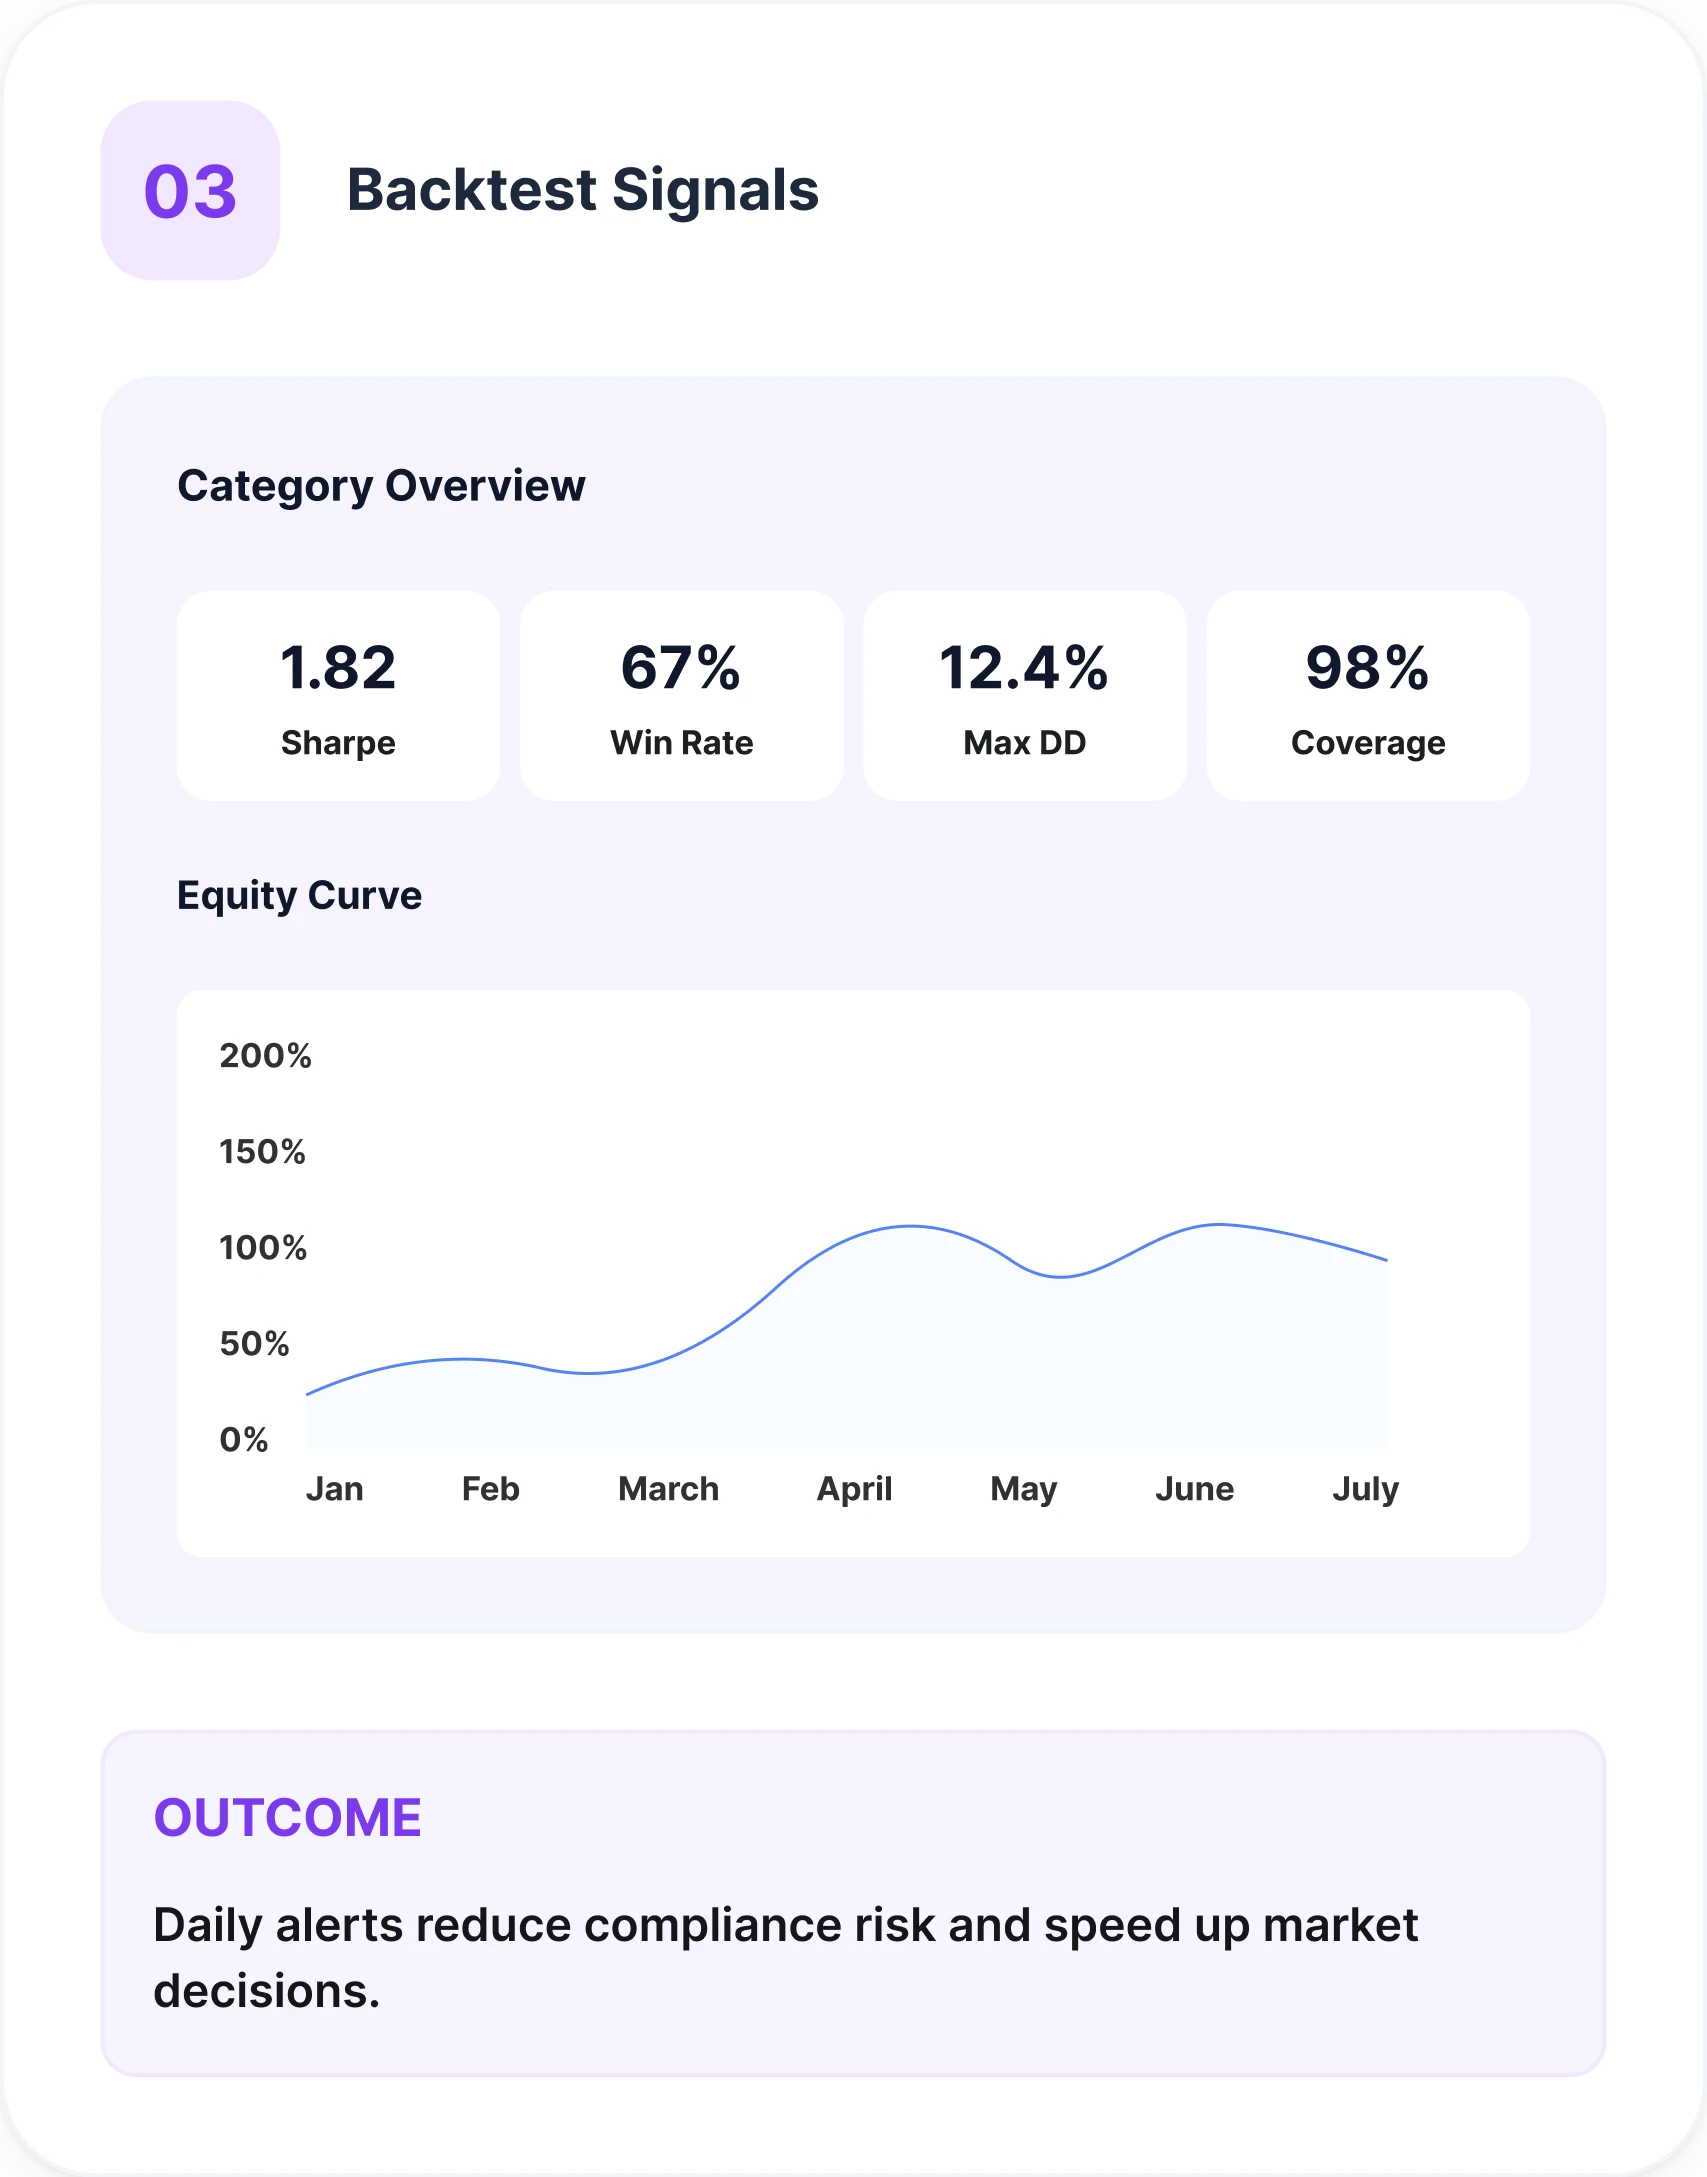
A backtest step where the team validates the signal before scaling to production

Step 3: You backtest

You backtest. If the signal holds, we scale to production.

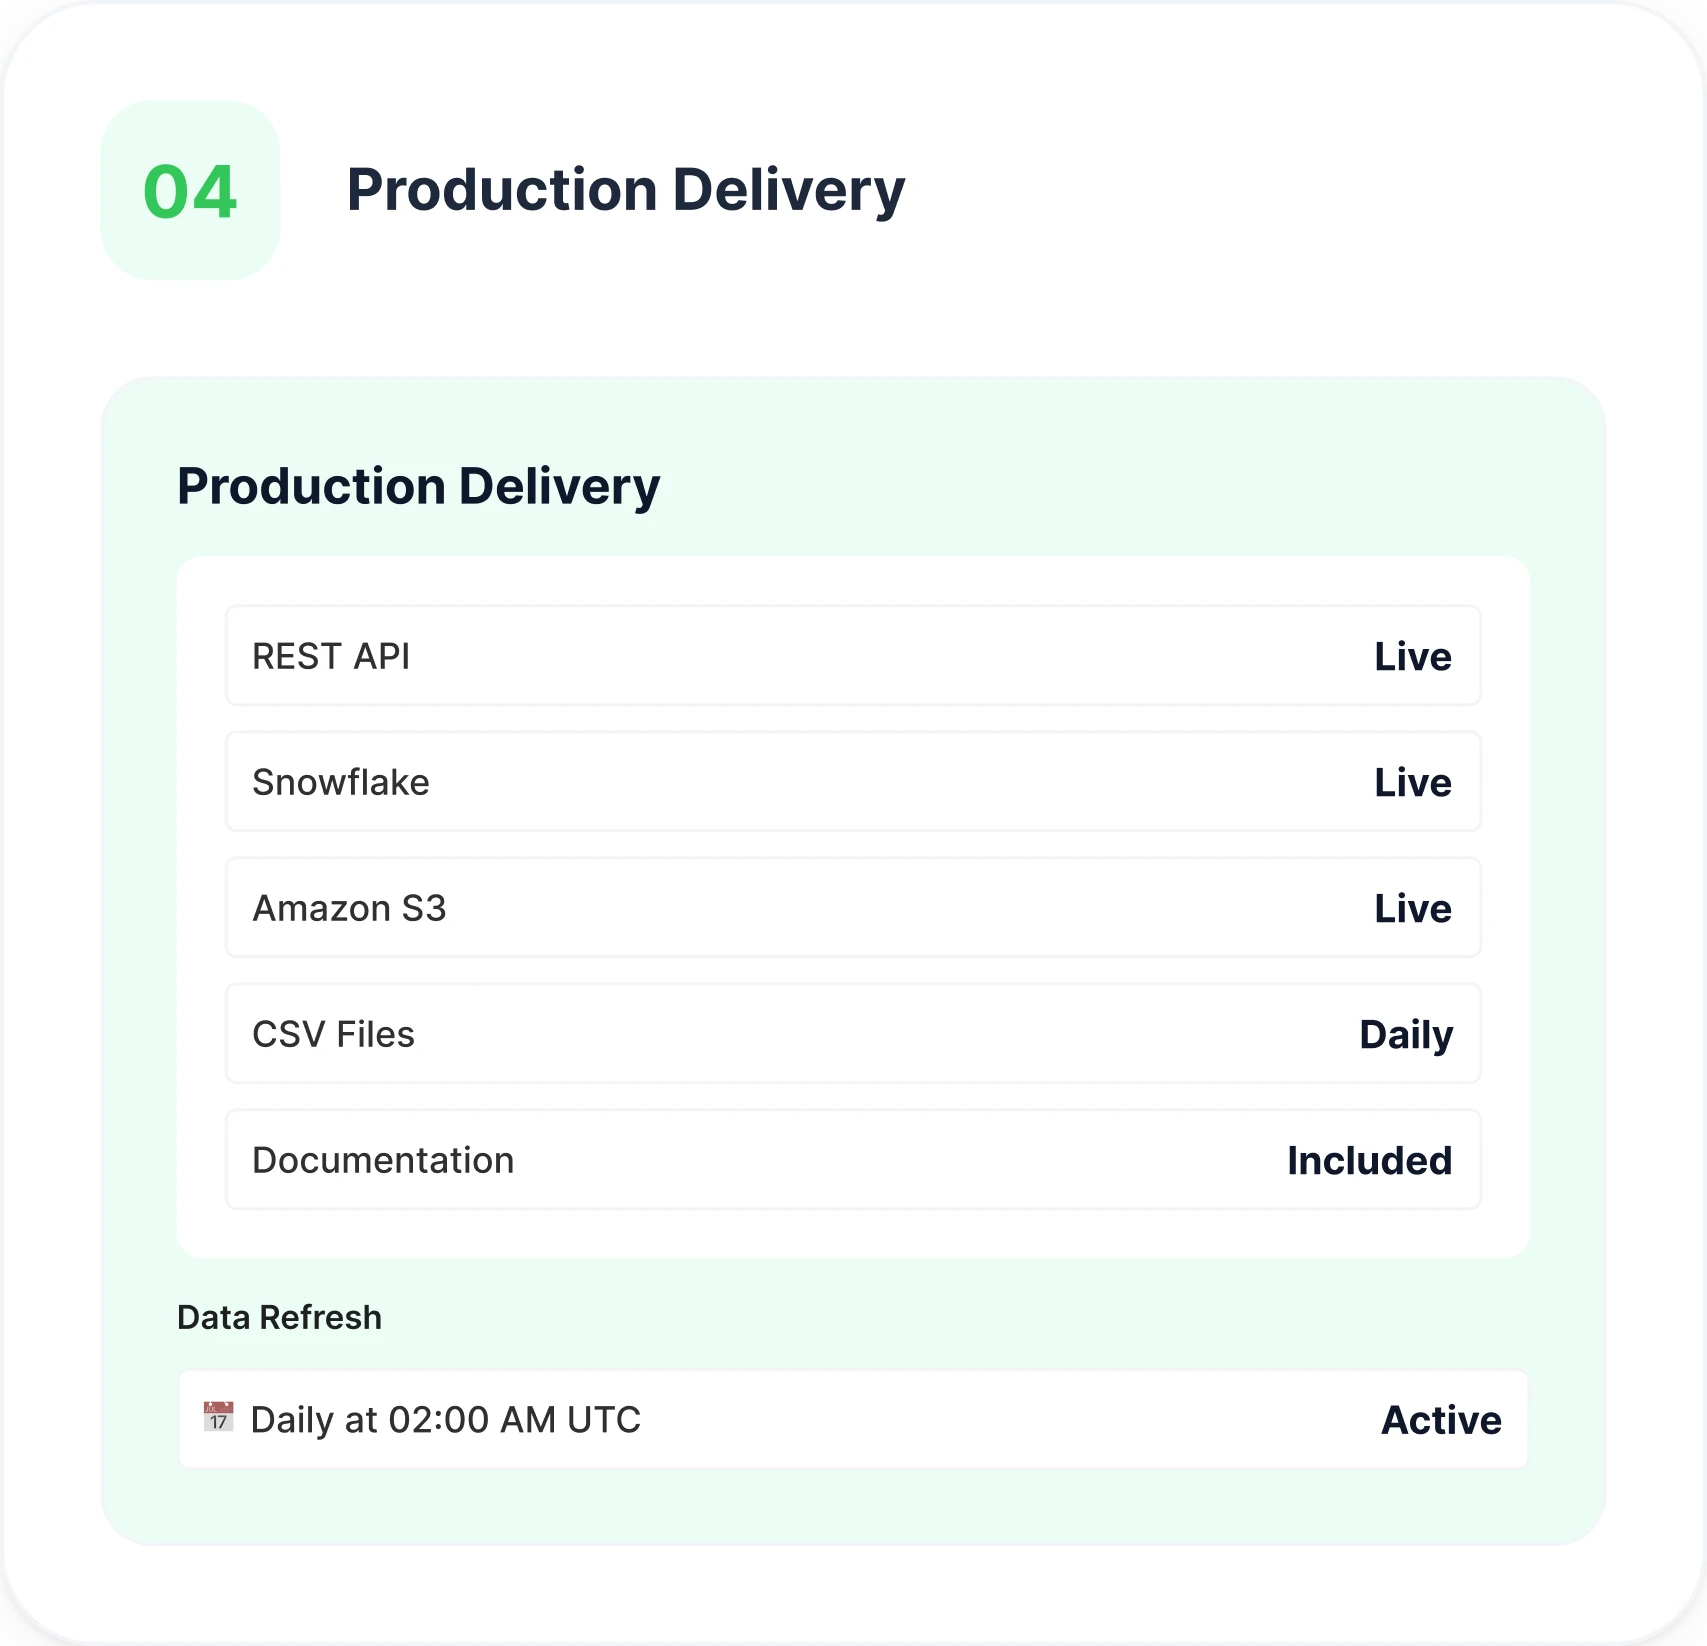
A production-delivery step with daily data via S3 or Snowflake and compliance documentation

Step 4: Production delivery

Daily delivery via S3 or Snowflake, with compliance documentation. Pilots start at $5,000. Production: $50,000 to $250,000/yr depending on coverage and signal depth.

Frequently asked questions

Hiring velocity, salary trends, skills demand, and workforce composition signals: all derived from human-verified job posting data.

Start with a pilot. Backtest before you commit.

Tell us which tickers, signals, and history depth you need. We scope coverage and deliver a sample dataset (2 to 4 weeks of data, 20 to 50 tickers). You backtest, and if the signal holds we scale to daily production delivery via S3 or Snowflake with full compliance documentation. Pilots start at $5,000. Production delivery runs $50,000 to $250,000/yr depending on coverage and signal depth.

No credit card. No commitment. Just clean data.

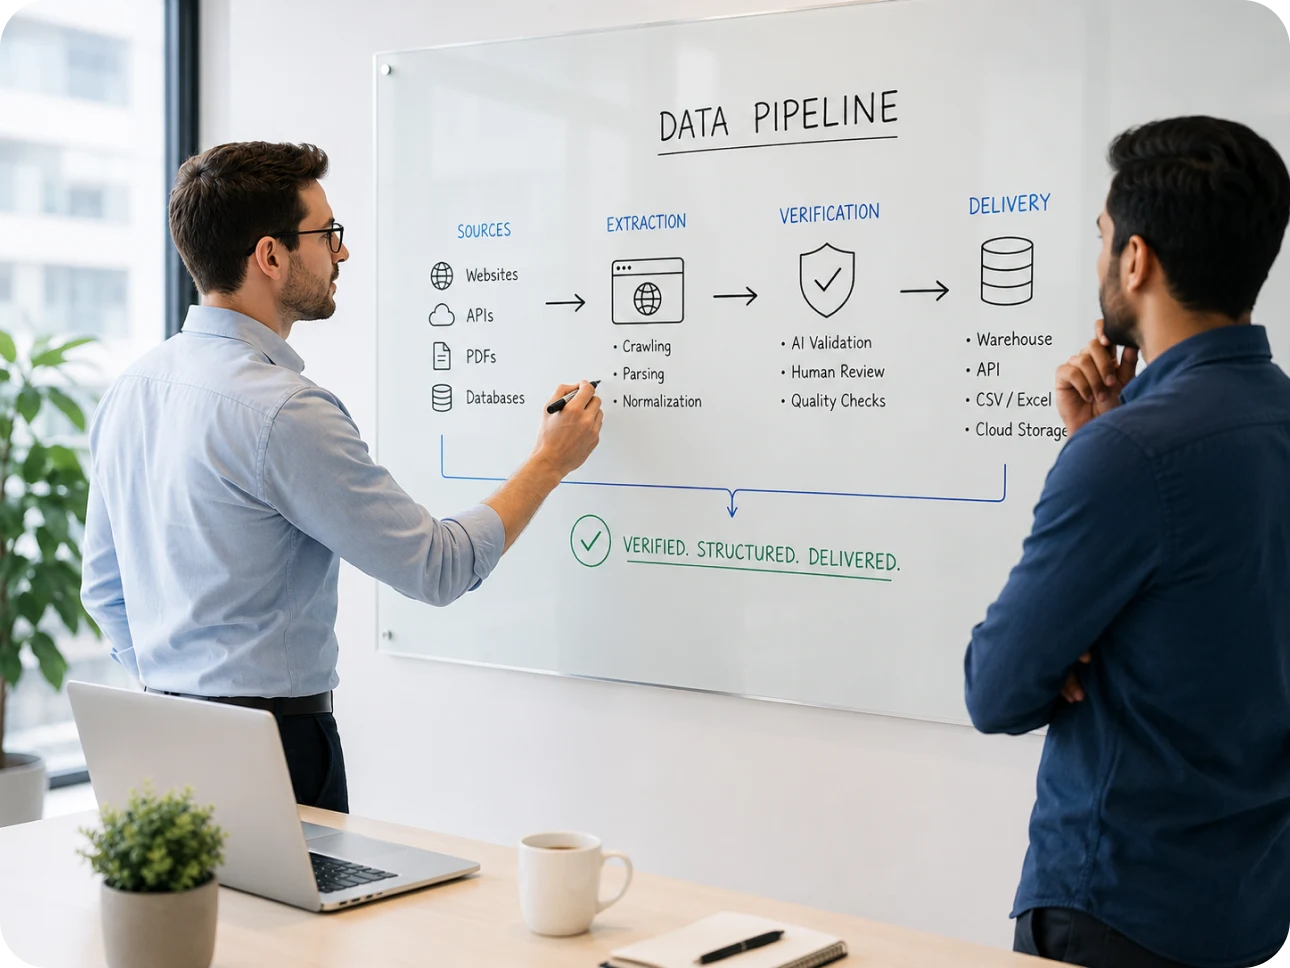
Two colleagues at a whiteboard mapping Crawlify's data pipeline — sources to extraction to verification to delivery